Enhanced Dashboard
Enhanced Dashboard
The upgraded DefectDojo dashboard provides users with an enhanced take on the base DefectDojo dashboard. With this custom dashboard, users are given full control of what overview information tiles are displayed (e.g. Passing Products or Active Critical Findings), what icons and colors best represent these custom tiles, as well as what metrics should be displayed.
Enhanced Dashboard and is configured globally for all users (e.g. all users will see the same custom dashboard).
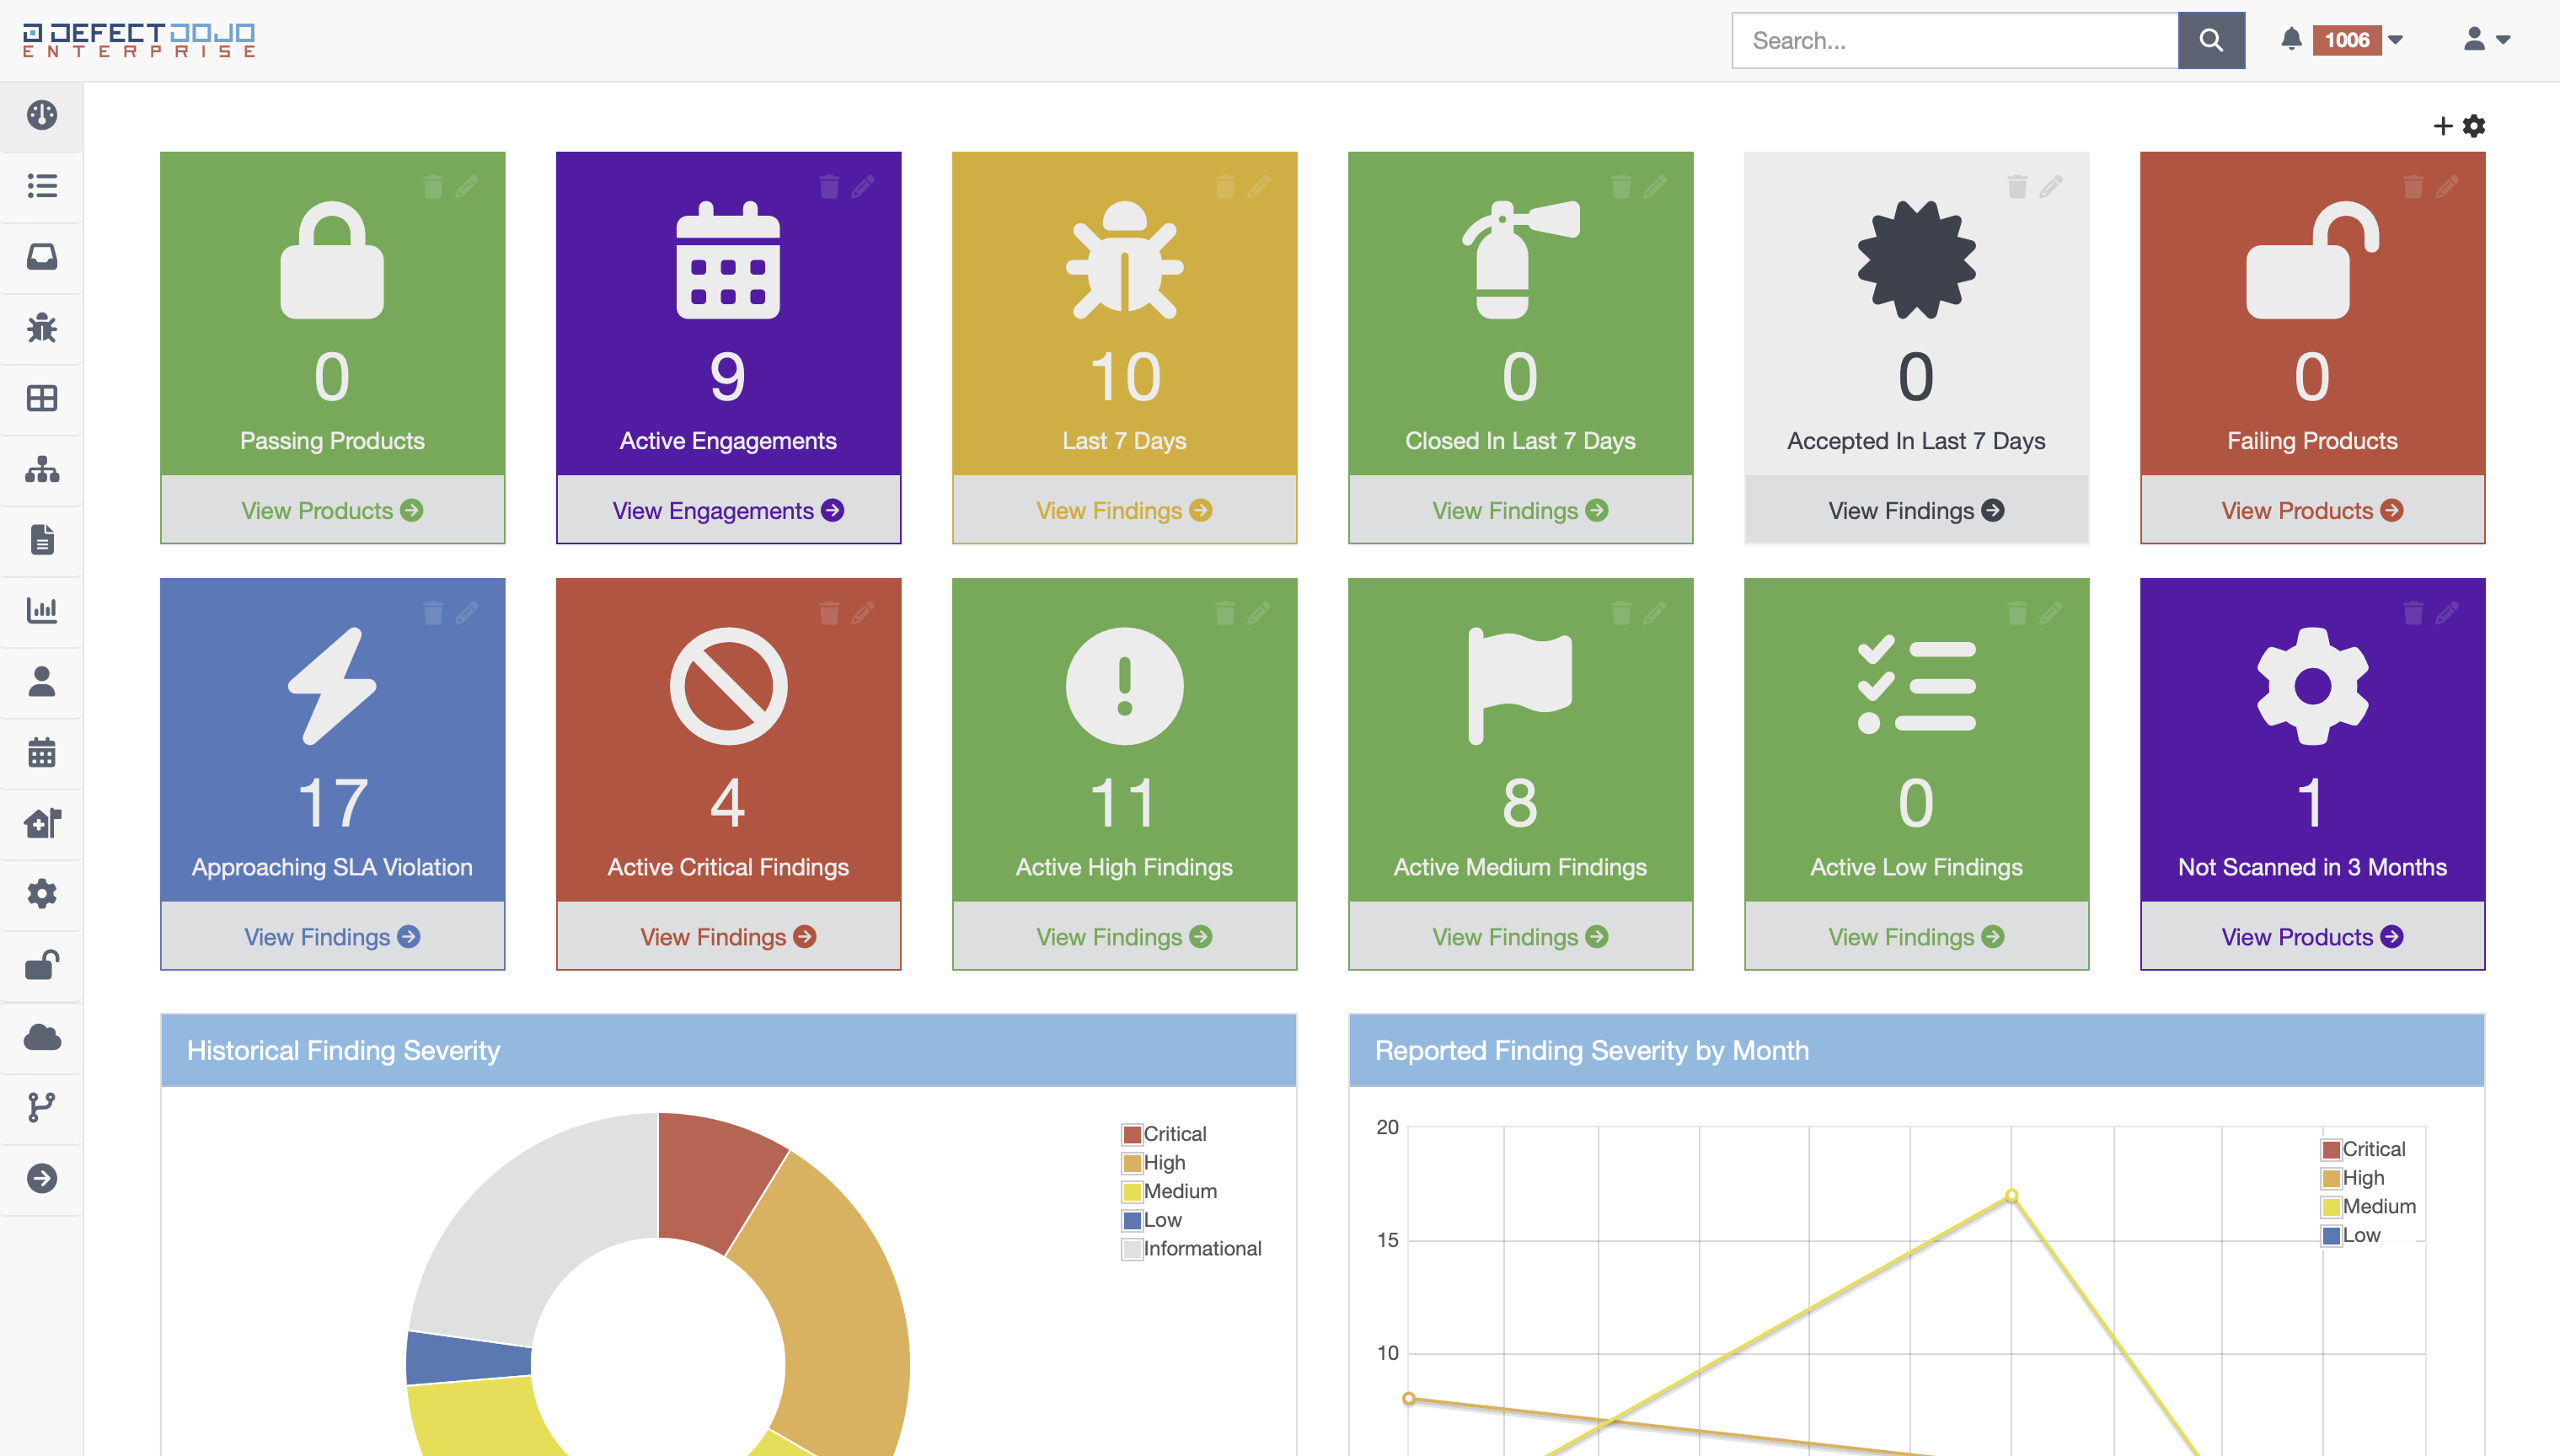
This upgraded dashboard for DefectDojo also includes dynamic color tiles, which allows specified tiles to take a range of colors based on minimum and maximum threshold values. With this feature enabled, a tile’s color will automatically change based on the data that it represents.
Enhanced Dashboard Settings
To customize the tables and graphs displayed on the enhanced dashboard, click the gear icon in the top right corner of the dashboard. A popup will be presented to customize the tables and graphs displayed on the Enhanced Dashboard.
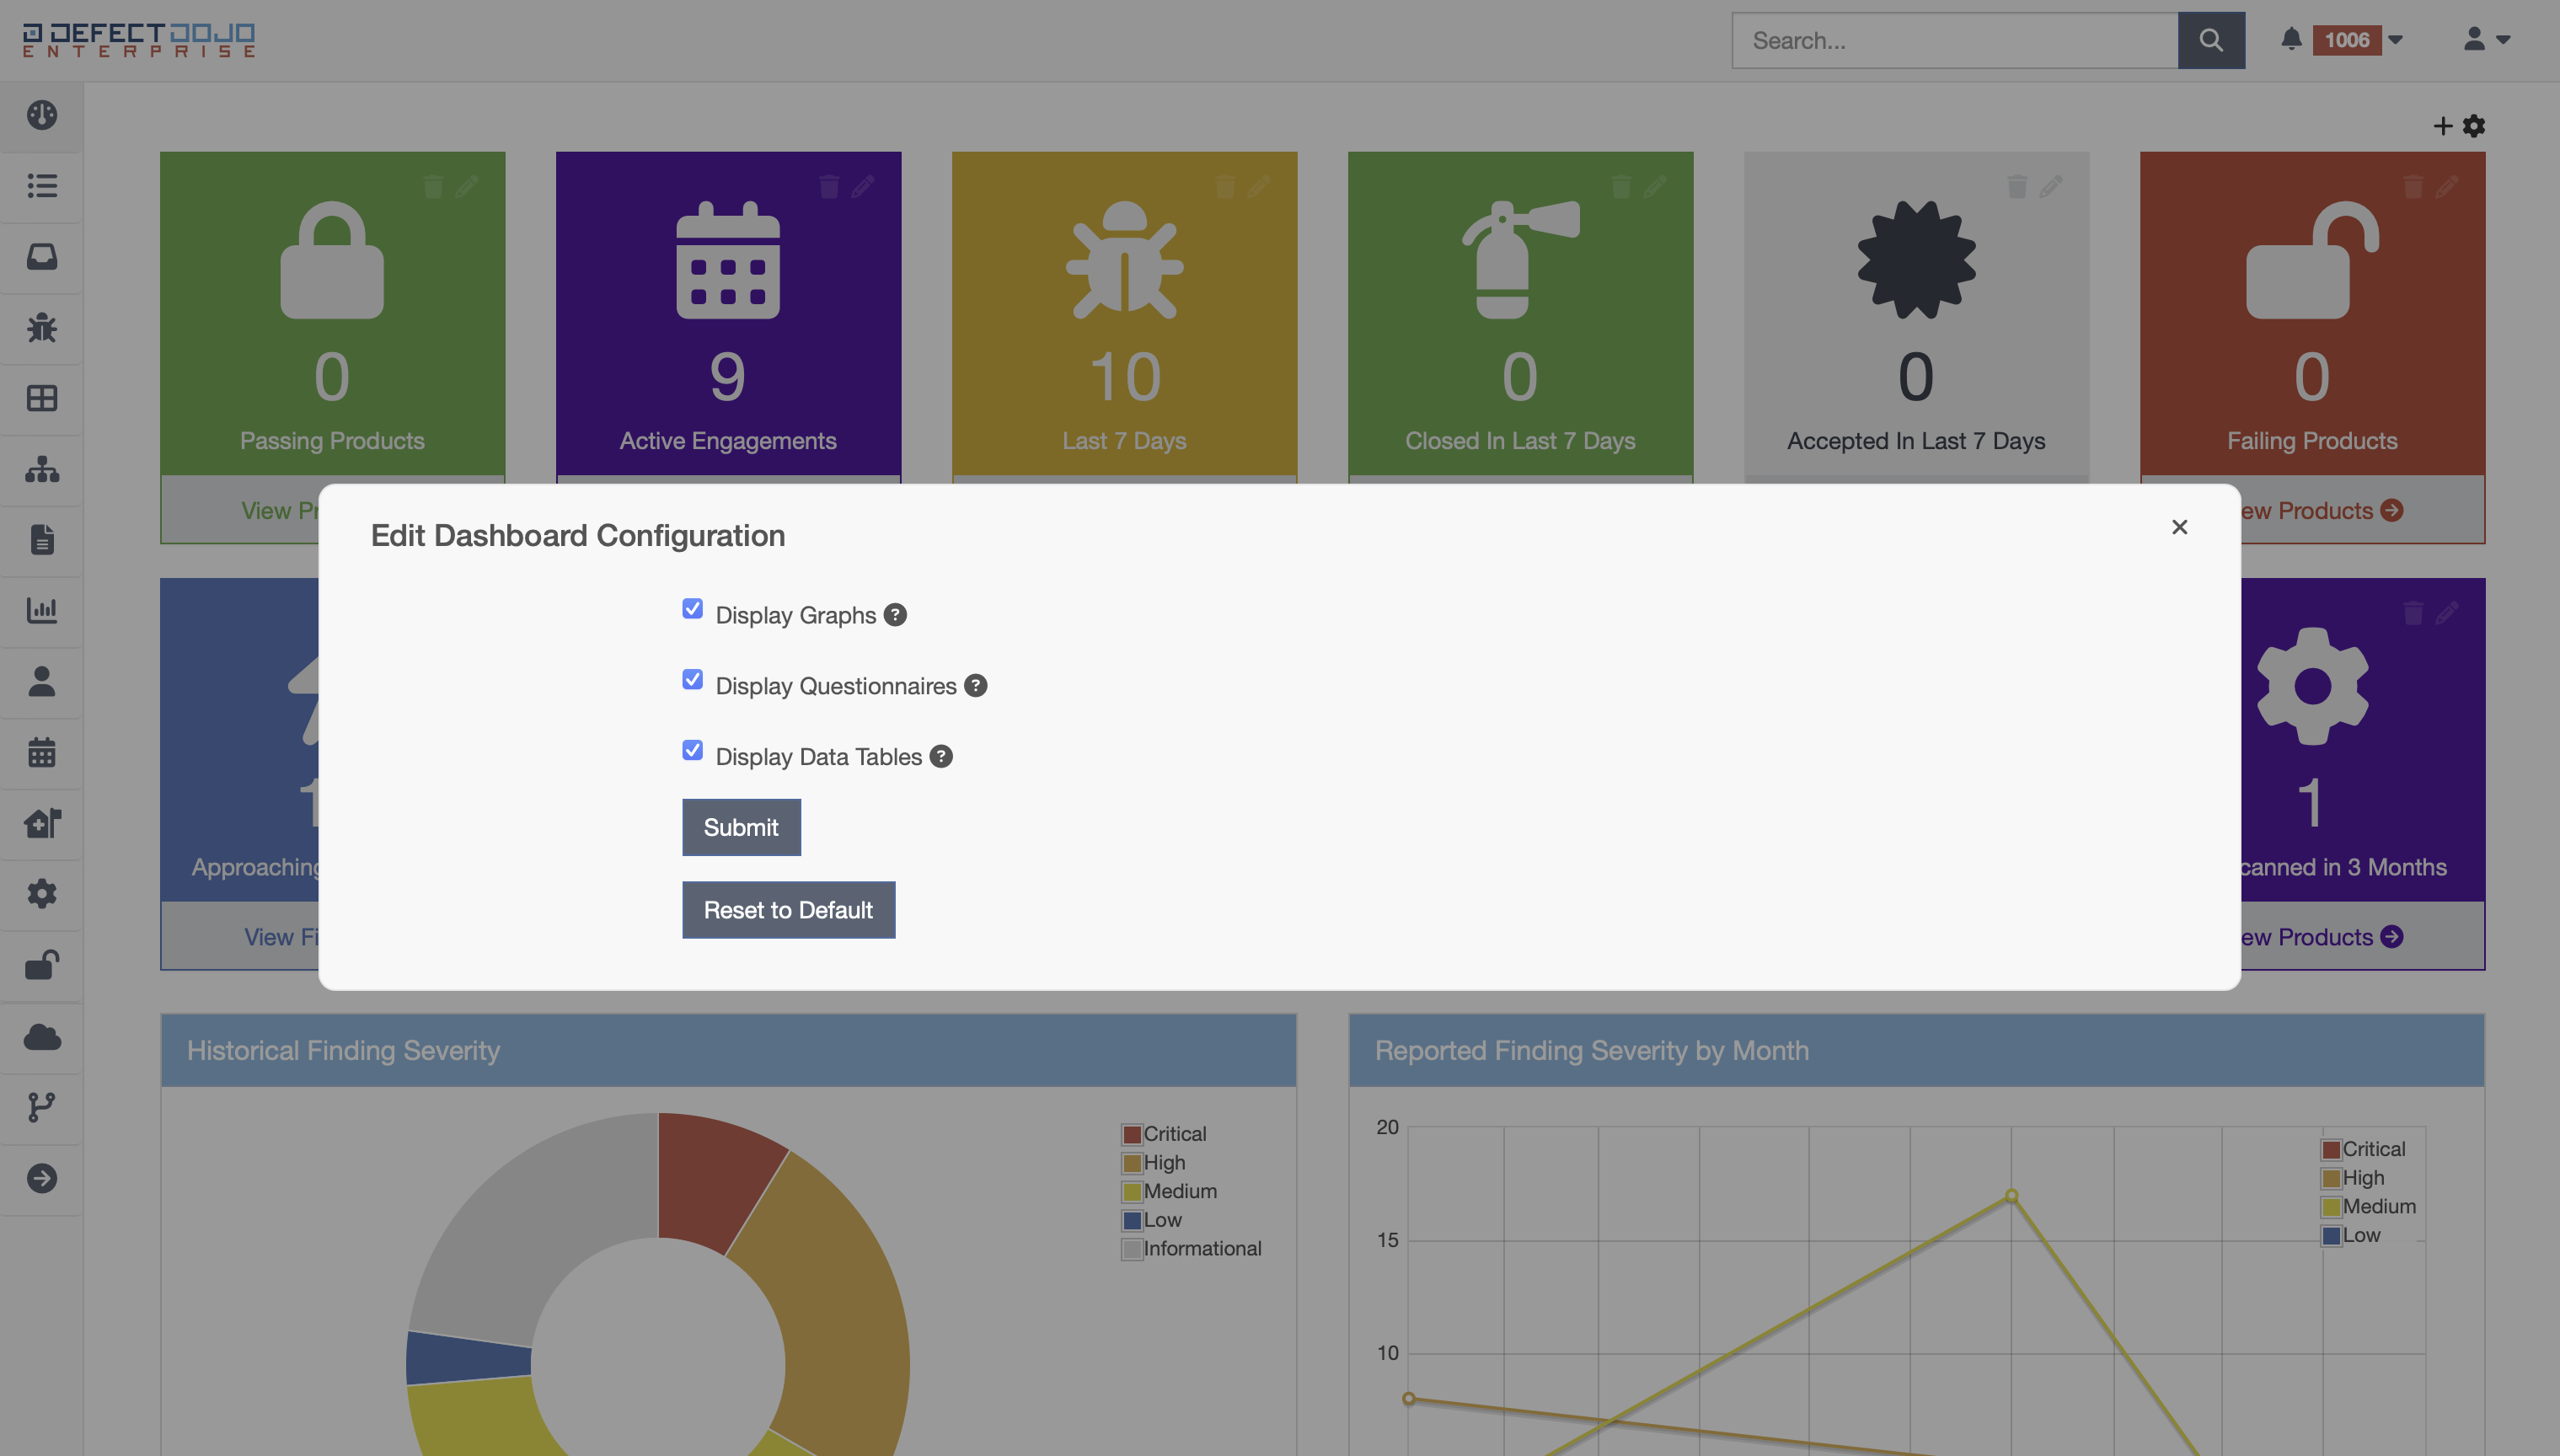
The following components of the dashboard can be hidden:
Graphs - When enabled, the Historical Finding Severity and Reported Finding Severity by Month graphs will be displayed on the dashboard
Questionnaires - When enabled, Unassigned Unanswered Engagement Questionnaires will be displayed on the dashboard
Data Tables - When enabled, the Top 10 Products and Bottom 10 Products data tables will be displayed on the dashboard
In addition to customizing the various components, the default tile configuration can be restored at any time by selecting Reset to Default.
Adding a Dashboard Tile
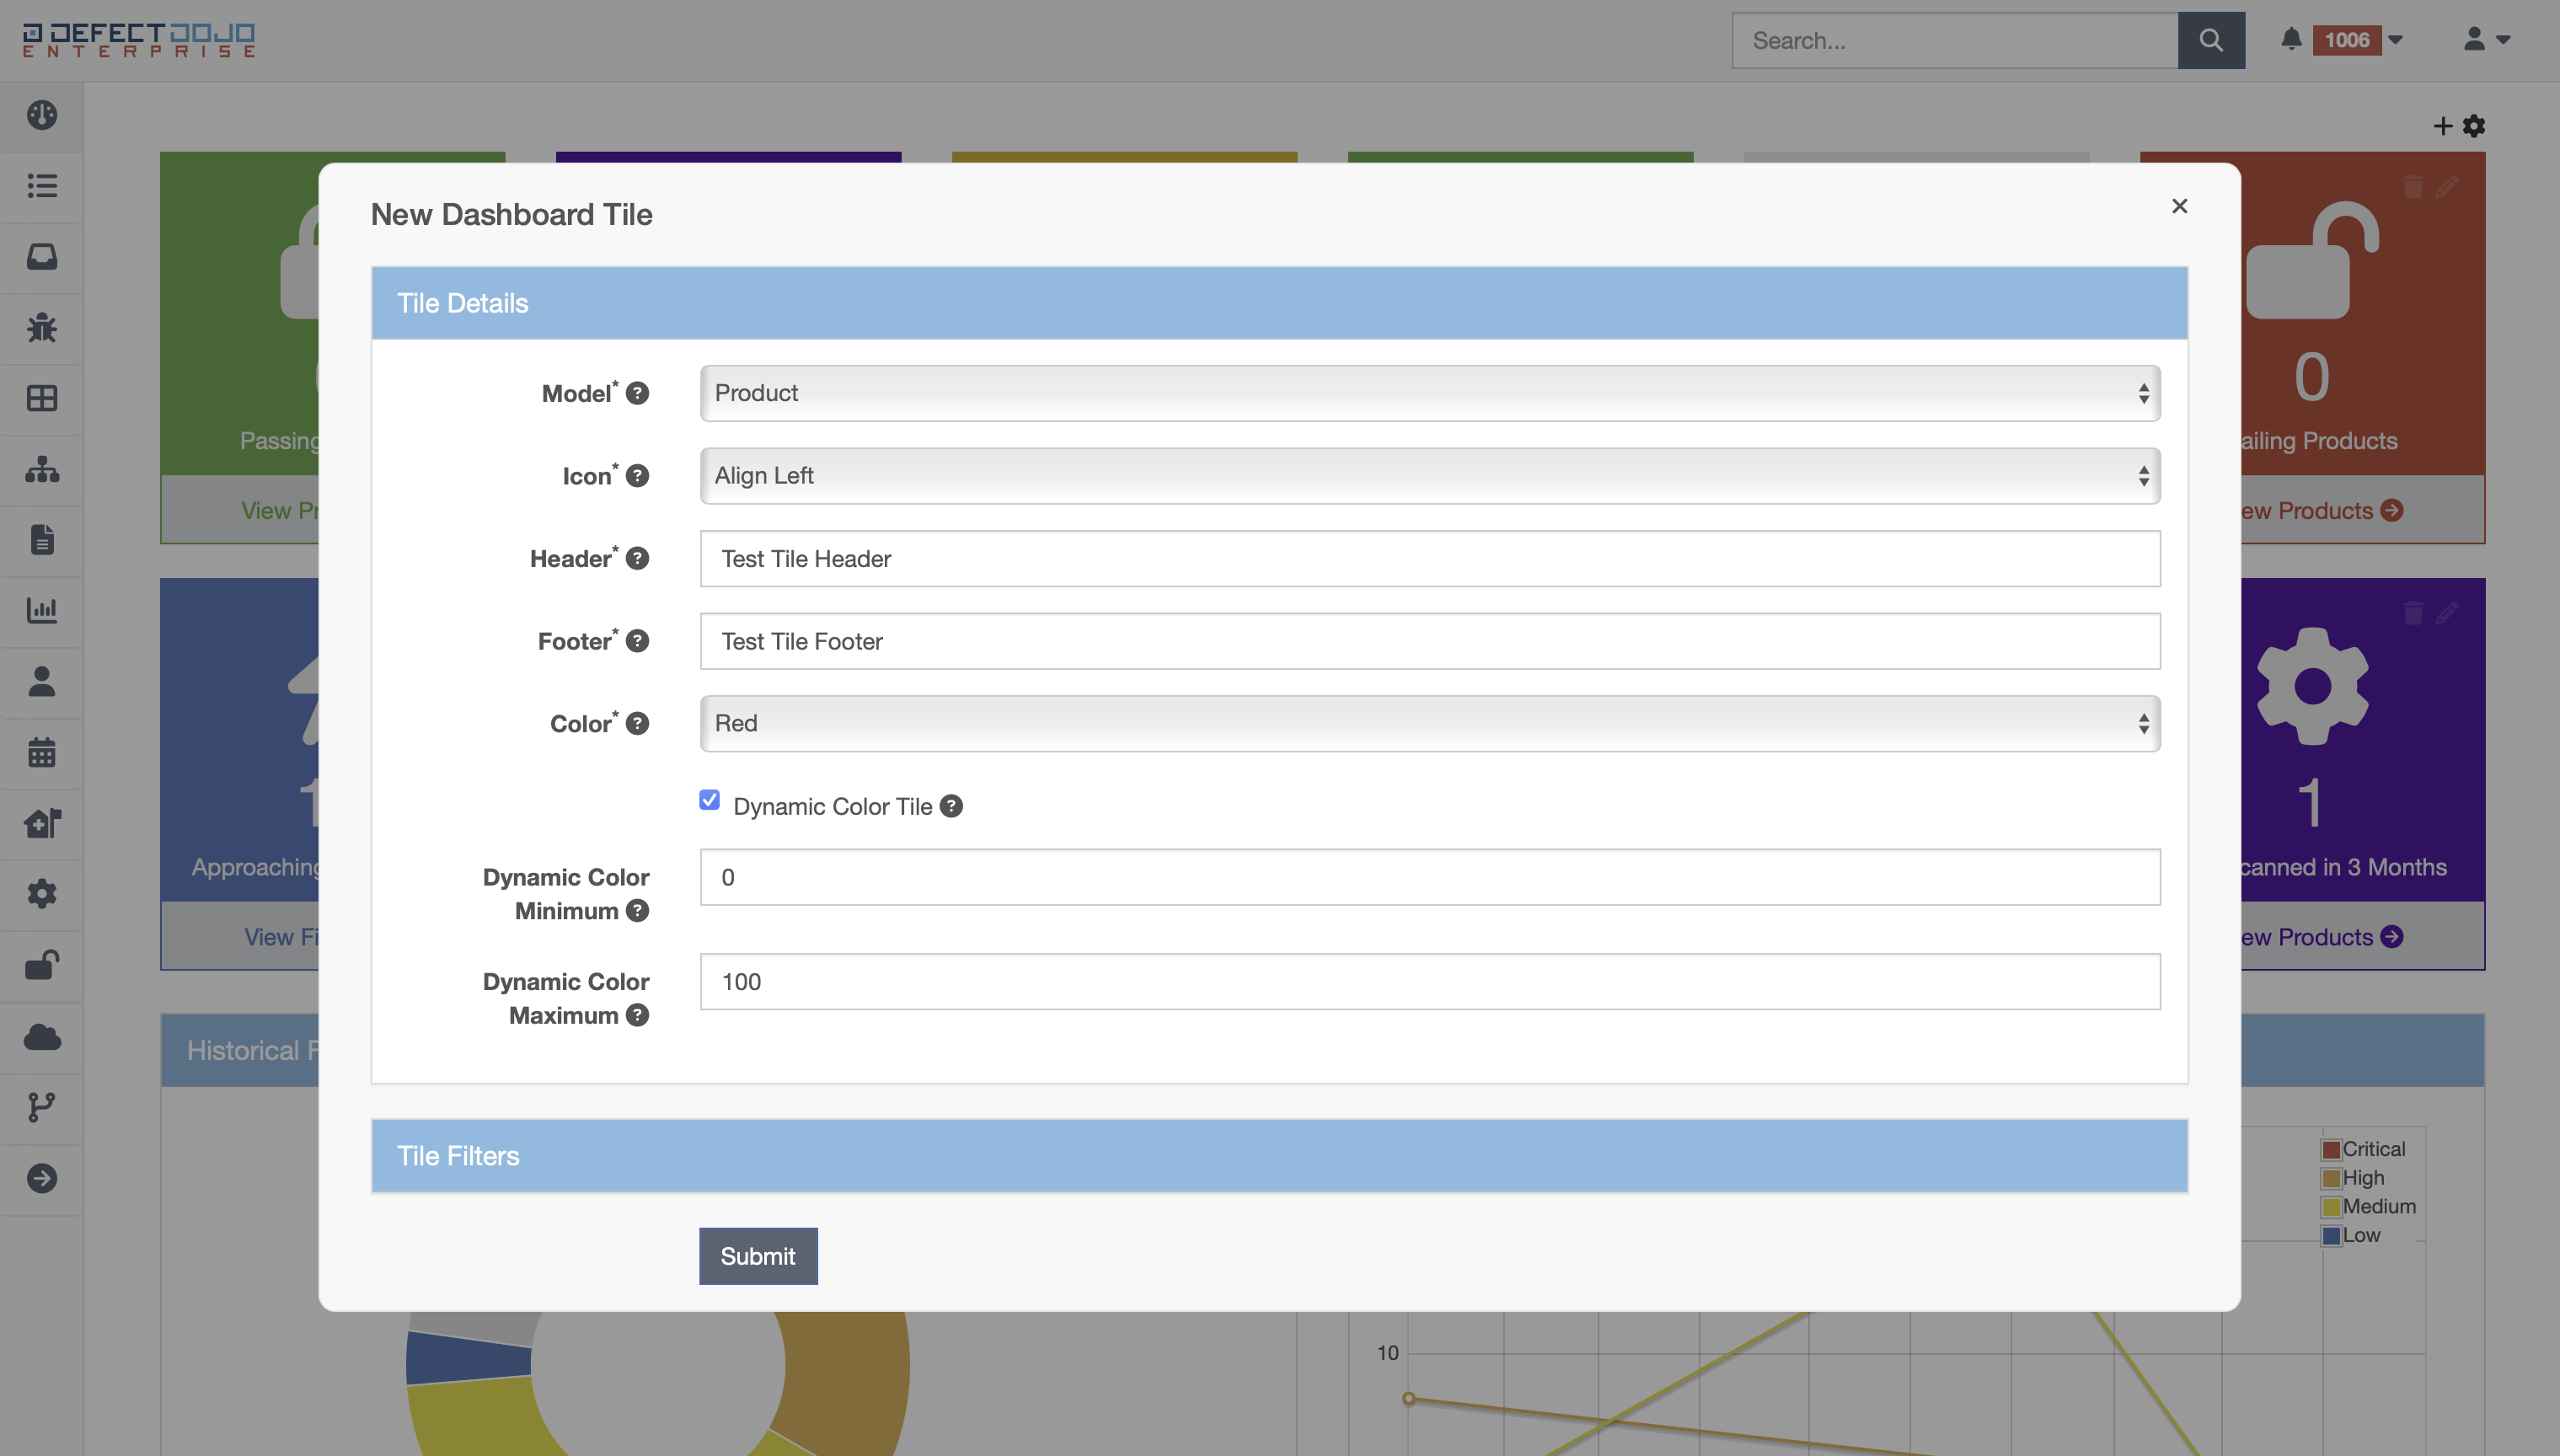
To add a dashboard tile, click the plus icon in the top right corner of the dashboard. A popup will be presented to create a new custom tile.
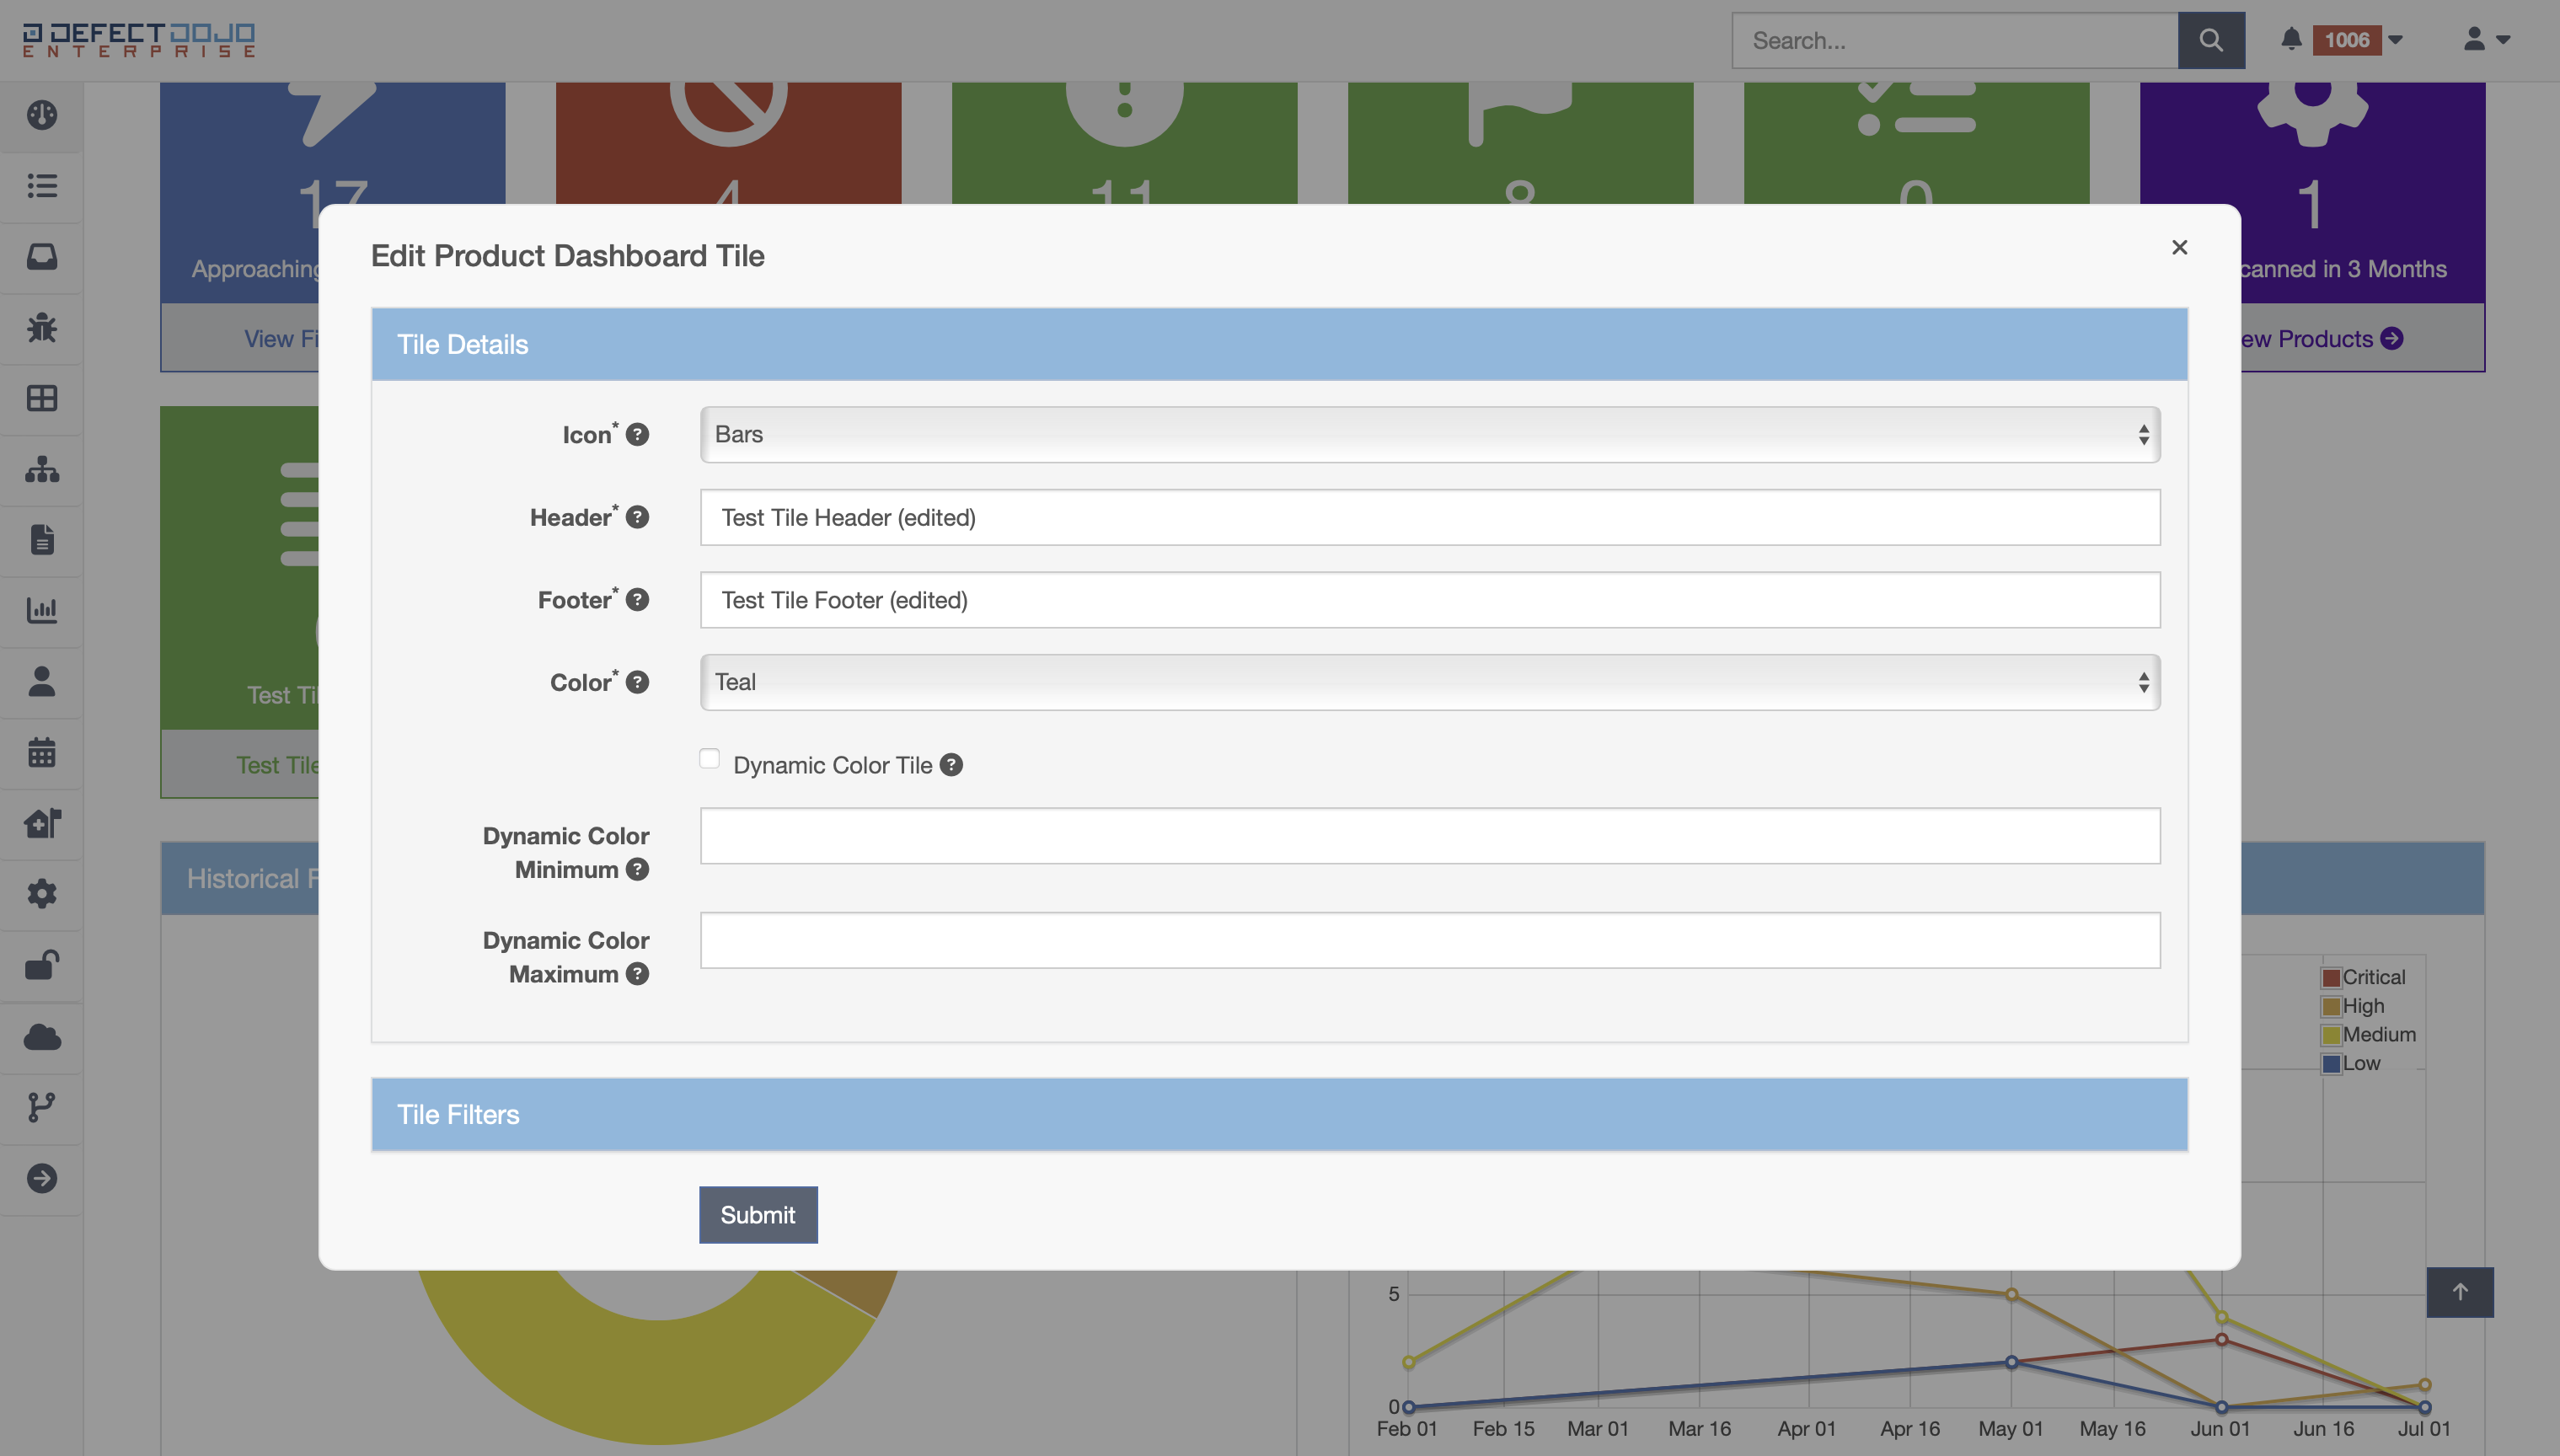
Tile Details
When creating a new tile, the following fields can be populated to set its characteristics:
Model (required) - The type of the tile (e.g. Product or Finding)
Icon (required) - The icon to display within the tile
Header (required) - The header text of the tile
Footer (required) - The footer text of the tile
Color (required) - The color of the tile (unless dynamic color calculation is enabled)
Dynamic Color Tile - When enabled, dynamic color minimum and maximimum values will be used to determine tile color
Dynamic Color Minimum - The minimum acceptable count threshold (i.e. when the tile count is below this value, it will be green in color)
Dynamic Color Maximum - The maximum acceptable count threshold (i.e. when the tile count is above this value, it will be red in color)
Note: Dynamic colors are calculated by dividing the difference of the maximum and minimum thresholds into for groups. Count values that fall below the minimum will result in a green tile, and values that fall above the maximium will result in a red tile. If the count value of the tile falls between the minimum and maximum, it will result in a green, yellow, orange, or red tile (depending on where it falls in the range).
Tile Filters
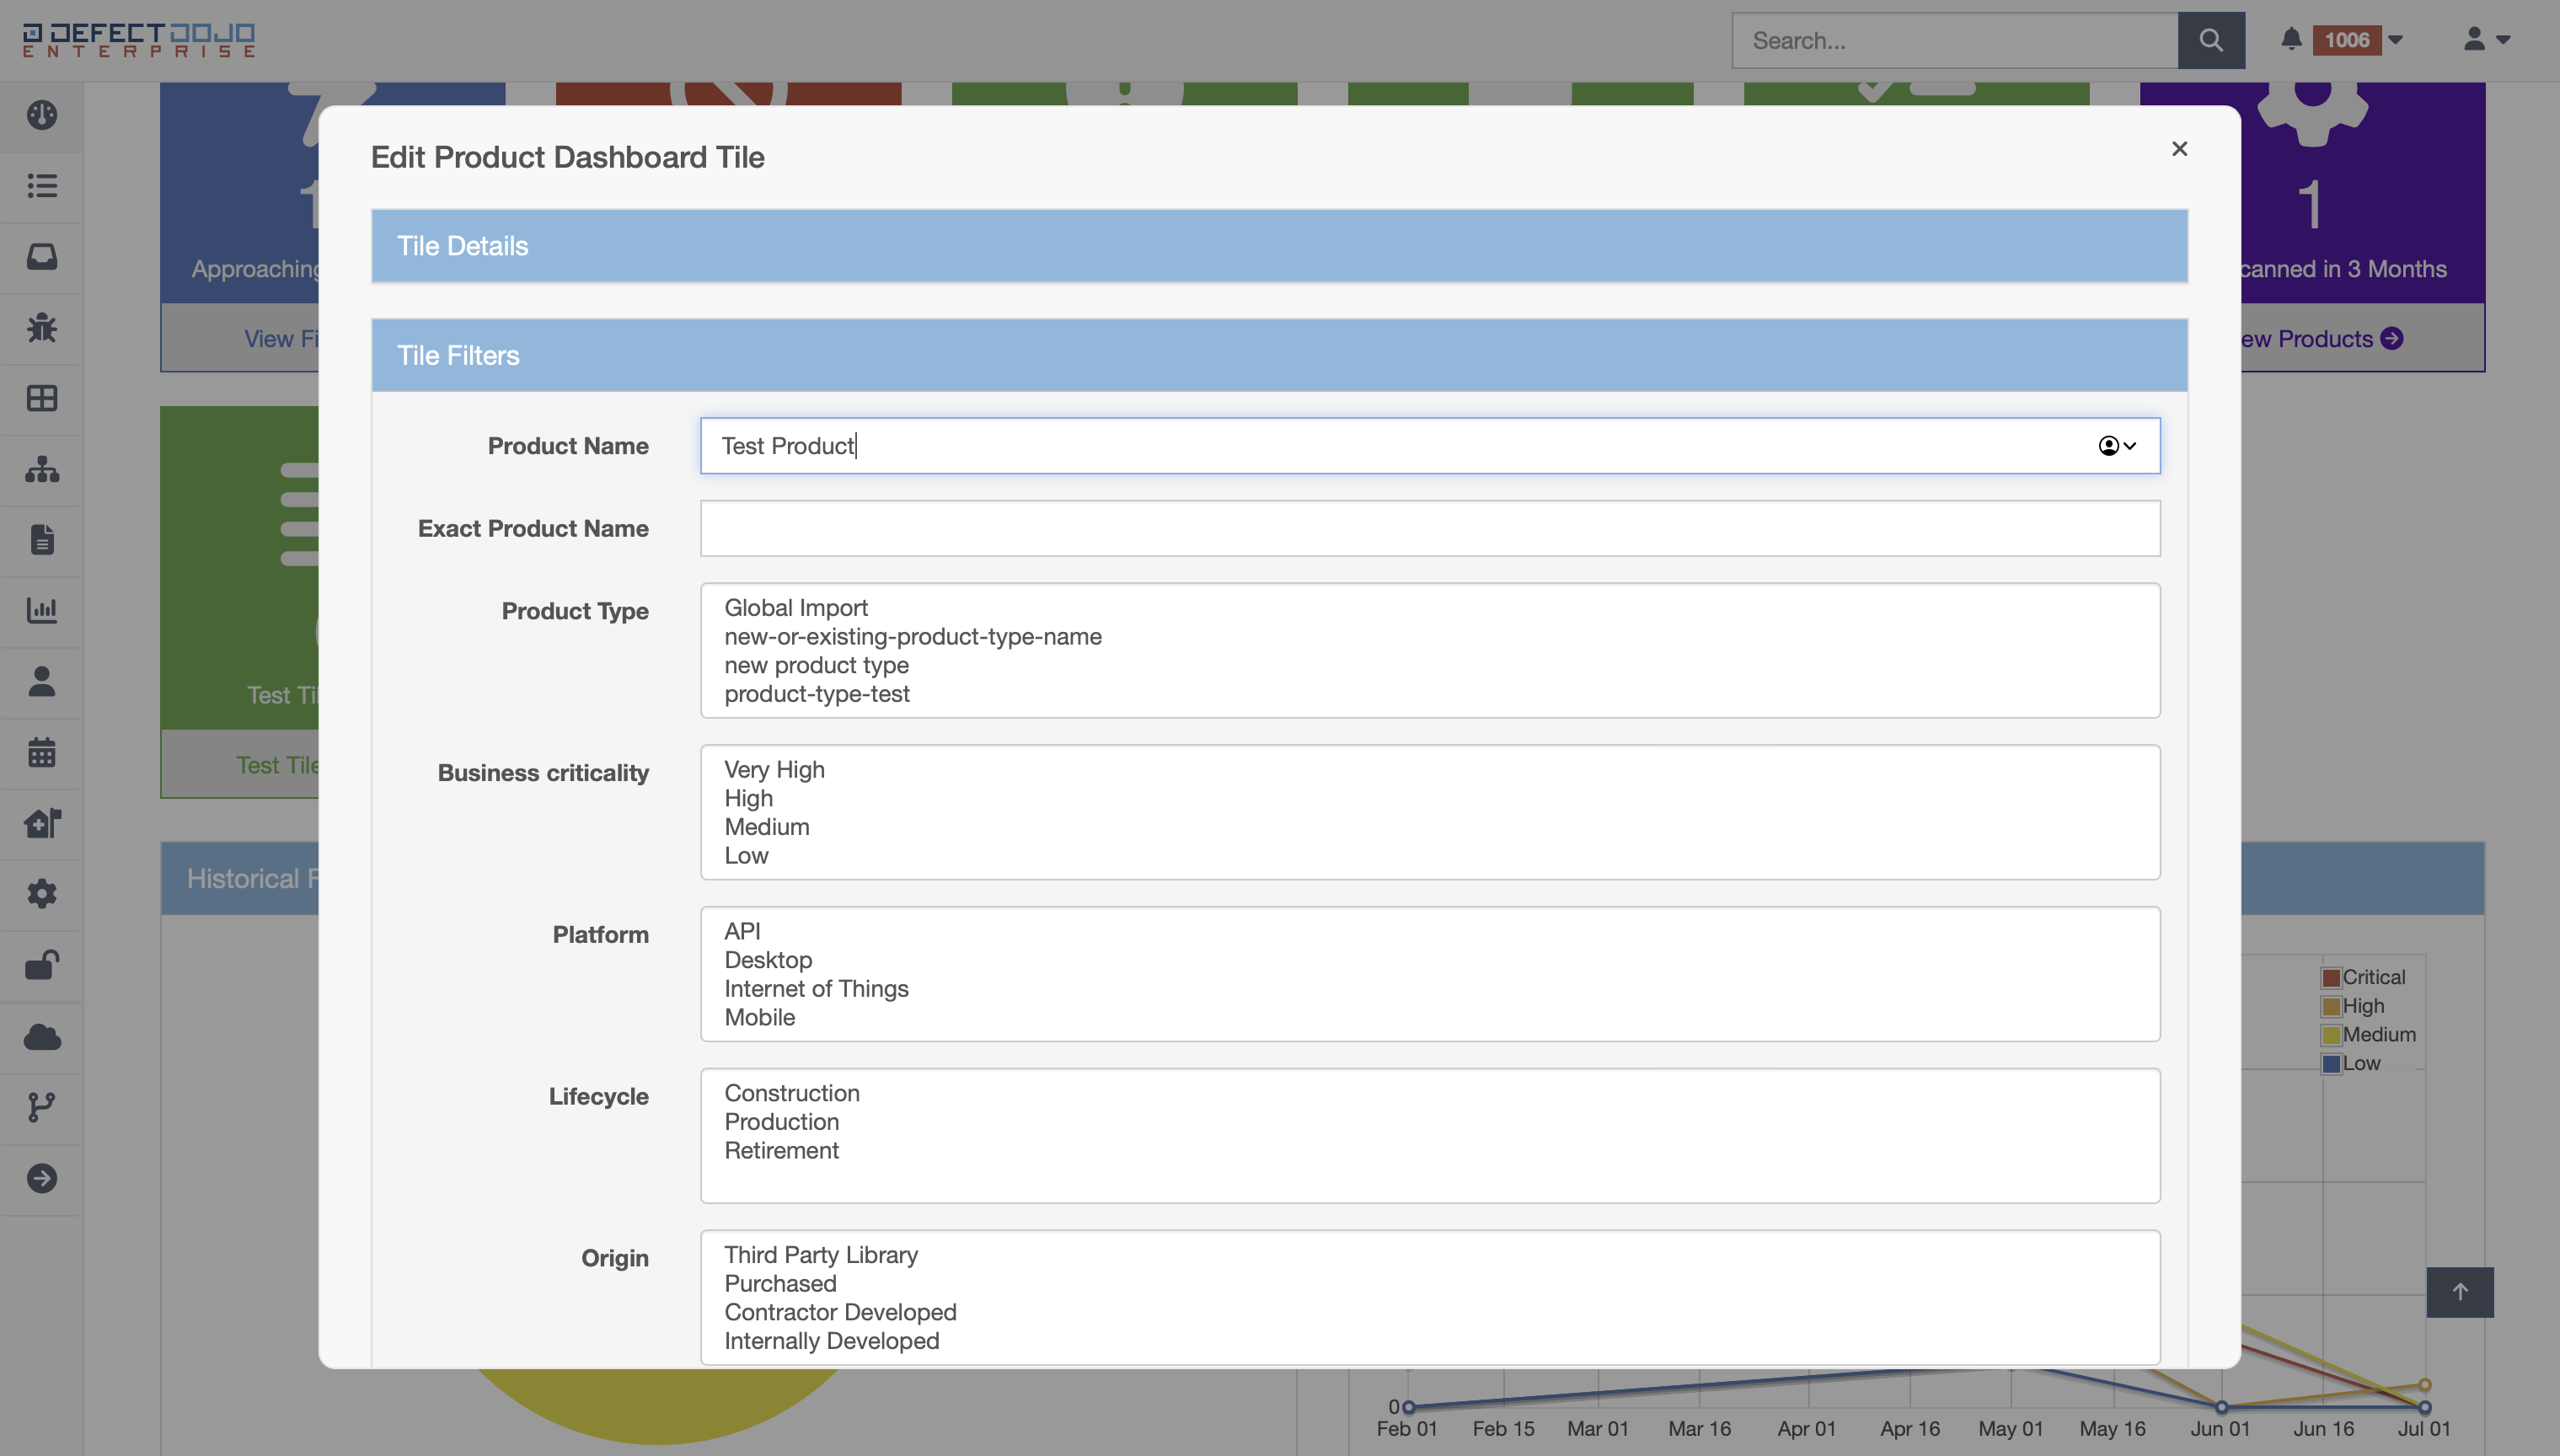
After the tile characteristics have been set, the filters can be set to pull and count desired information to be shown in a given tile.
Once the tile information has been set, use the Submit button to add the new tile.
Editing a Dashboard Tile
To edit a specific dashboard tile, click the pencil icon in the top right corner of the tile.
A popup will be presented to change the tile details and filters in the same way that they were added before.
Once all desired changes to a tile have been made, use the Submit button to update the tile’s details or filters.
Note: A tile’s model (or type) cannot be changed once it is created. If the type of the tile needs to be changed, it must be deleted and re-added with the desired model (or type).
Deleting a Dashboard Tile
To delete a specific dashboard tile, click the trash can icon in the top right corner of the tile.
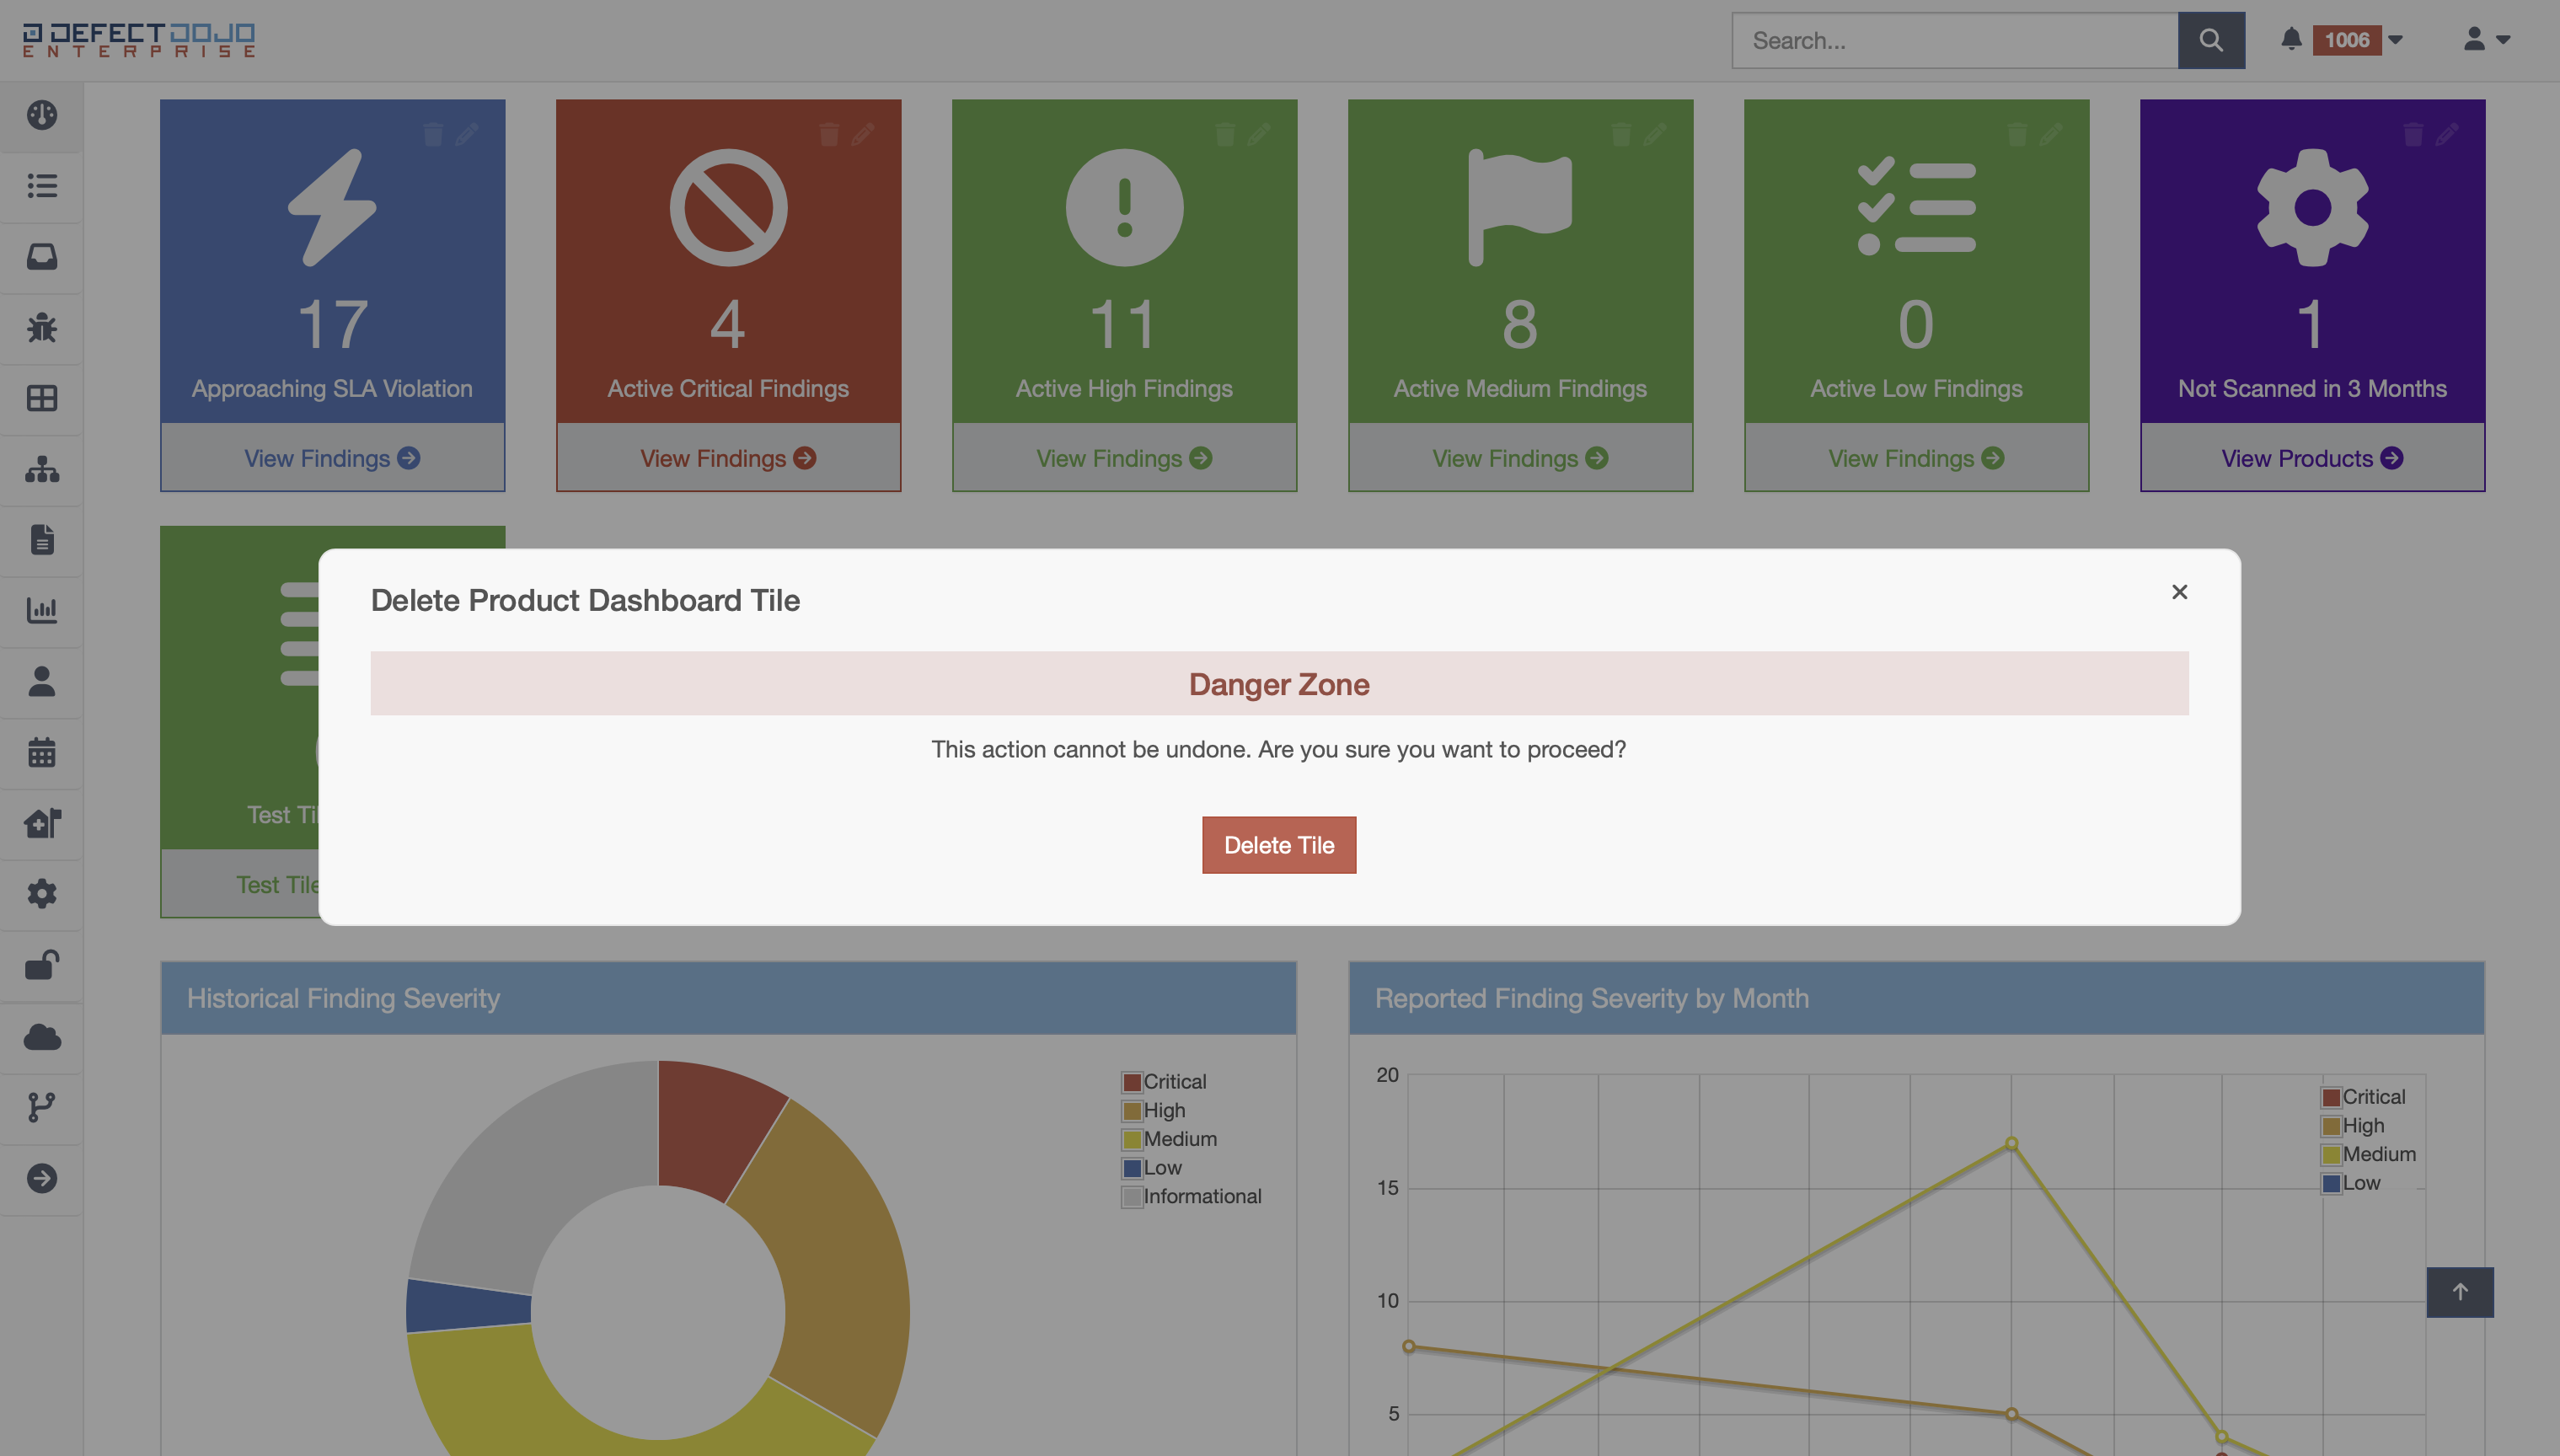
A popup will be presented asking for this change to be confirmed, and to ensure the delete operation does not occur by accident.
To proceed with deleting a tile, use the Delete Tile button to remove the tile.
Enhanced Dashboard Tile Types
The Enhanced Dashboard offers numerous tile types that support the existing models in DefectDojo.
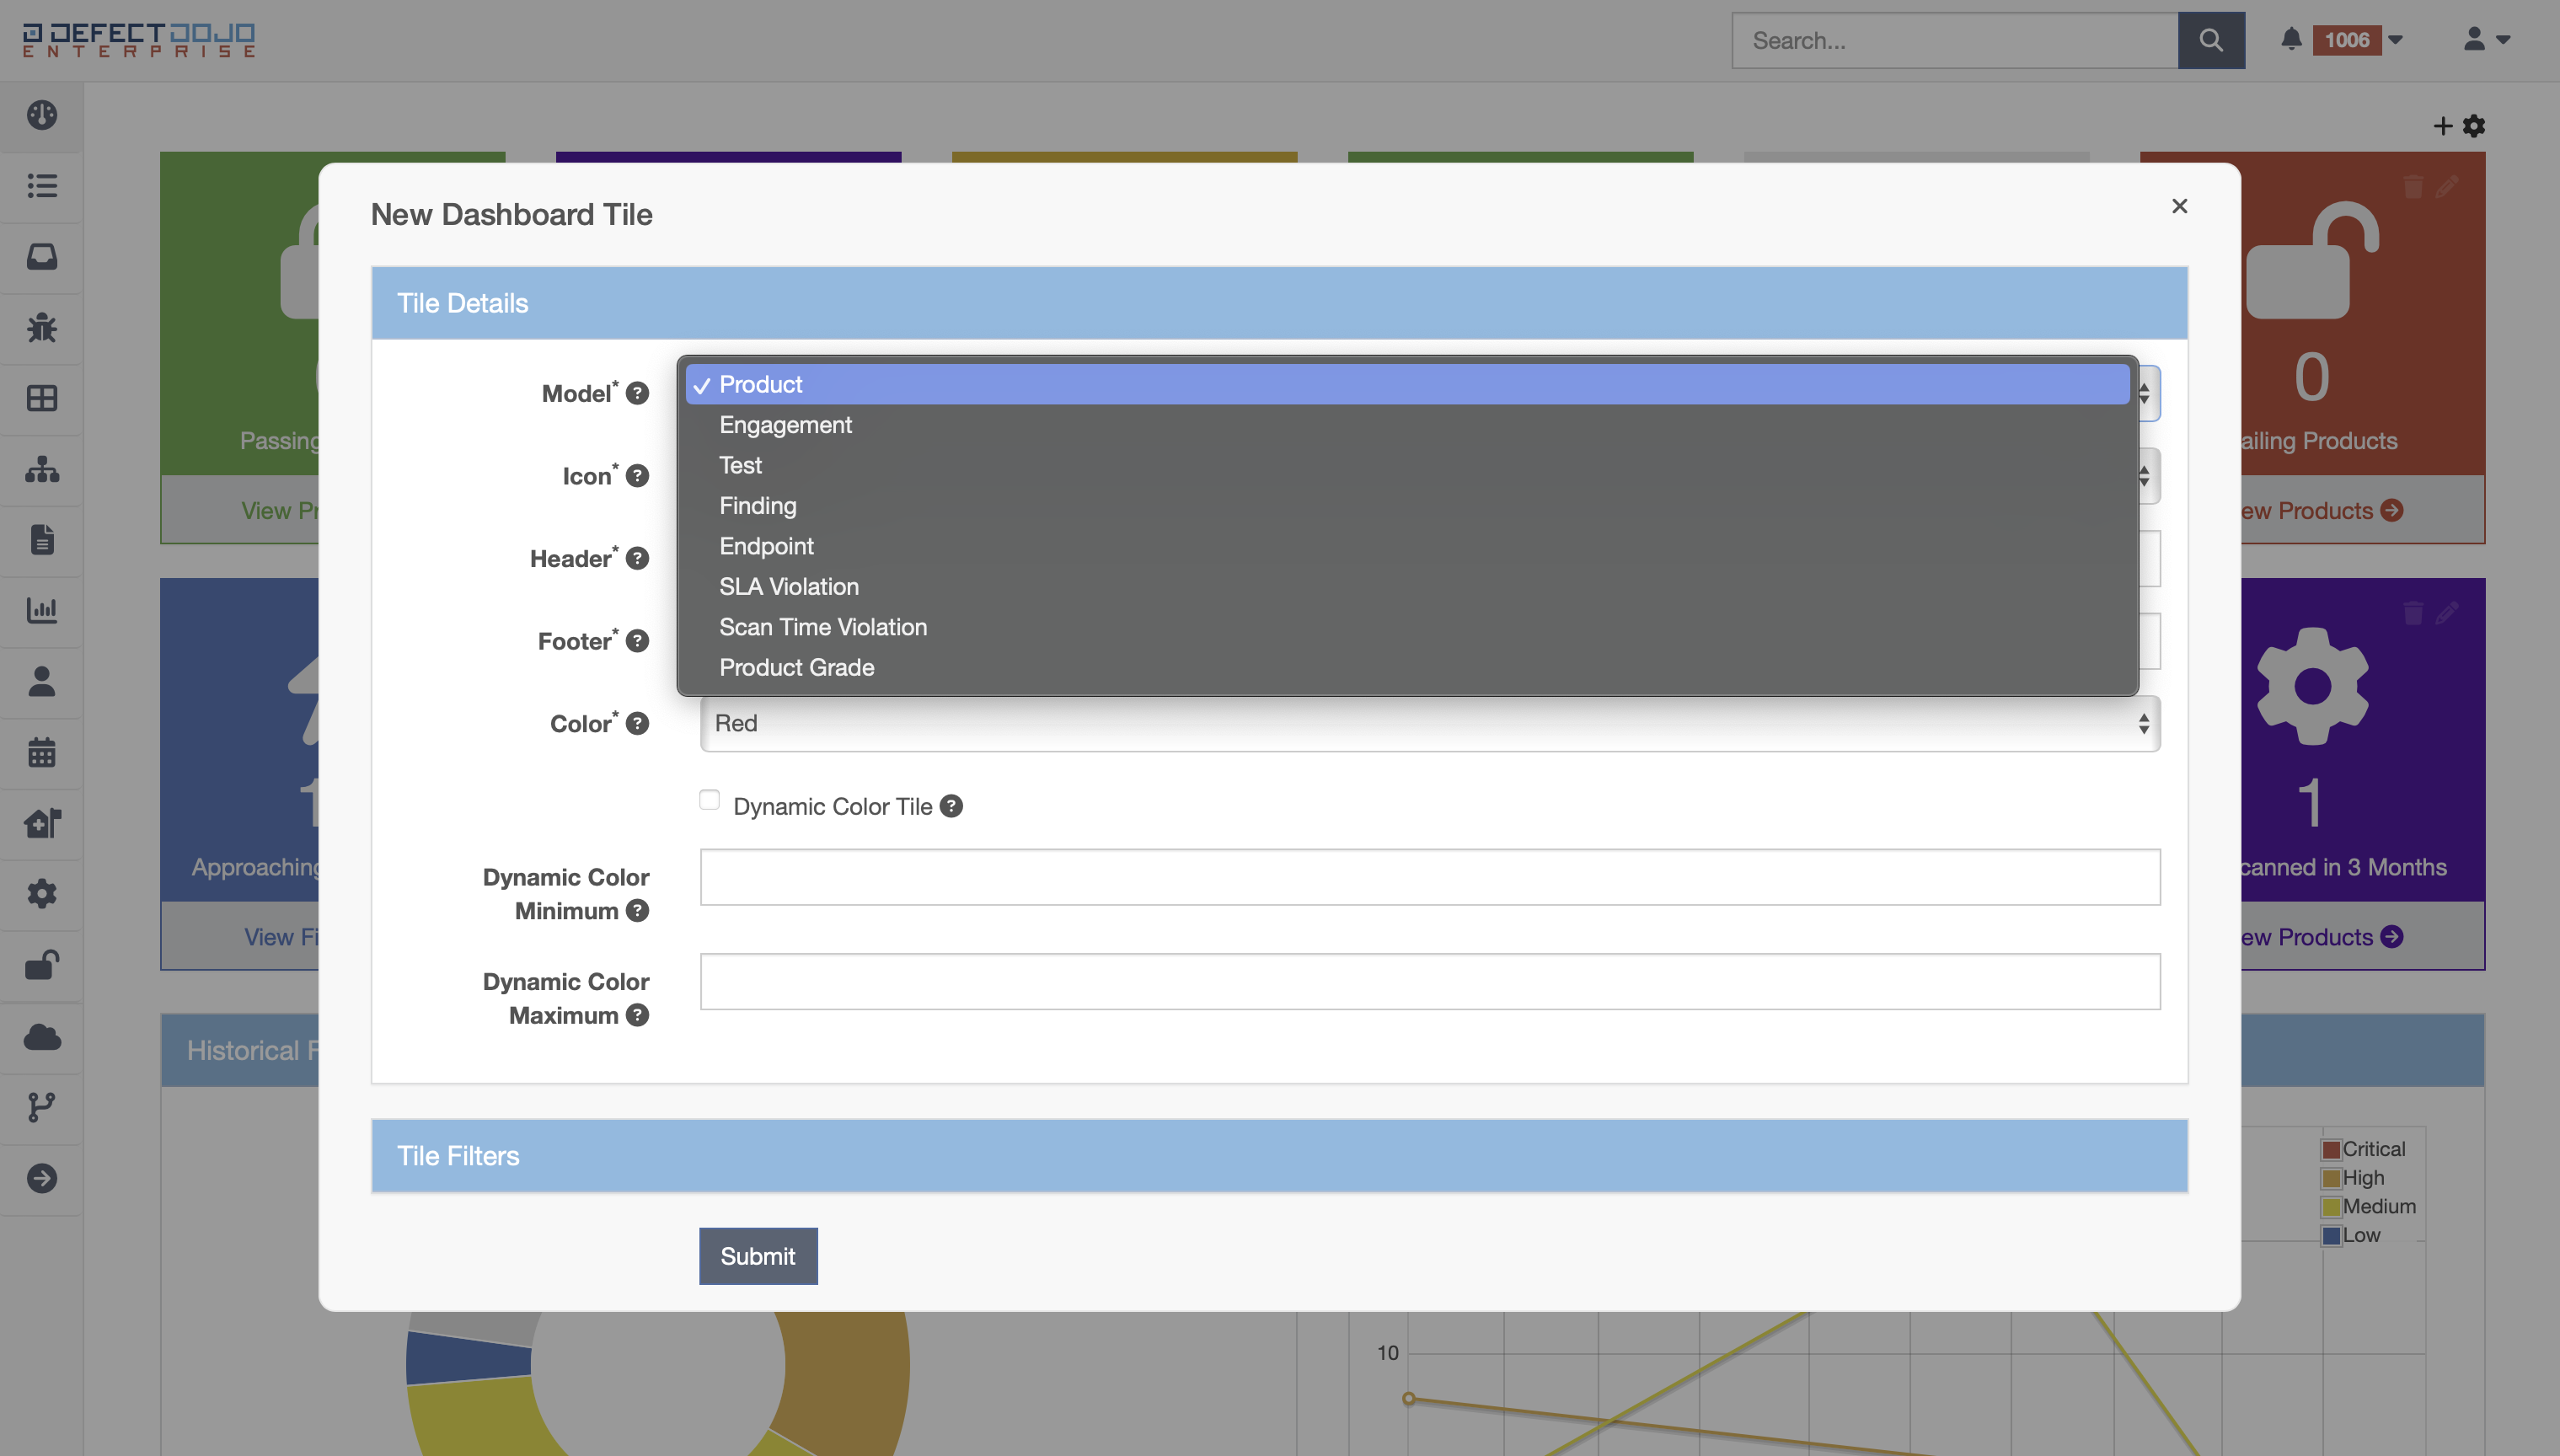
Product - The Product tile type supports counting products that meet the filter requirements (e.g. products such that their name contains the word “Production”, or the tag “prod”)
Engagement - The Engagement tile type supports counting engagements that meet the filter requirements (e.g. engagements that are of “Blocked” status, or belong to the product with the name “Test Product”)
Test - The Test tile type supports counting tests that meet the filter requirements (e.g. tests with the name “Test Scan”, or are of “Nessus WAS” scan type)
Finding - The Finding tile type supports counting findings that meet the filter requirements (e.g. findings with a severity of “Critical”, or were imported from “Nessus WAS”)
Endpoint - The Endpoint tile type supports counting endpoints that meet the filter requirements (e.g. endpoints that exist under a product with a name of “Test Product”)
SLA Violation - The SLA Violation tile type supports counting products that violate their SLA configuration (e.g. all products that are 5 days from an SLA configuration violation)
Scan Time Violation - The Scan Time Violation tile supports counting products that violate a set scan time constraint (e.g. all products that are 5 days past the scan time constraint)
Product Grade - The Product Grade tile supports counting products that are within a specified product grade (e.g. all products that are a grade B or above)
Note: Product Grade tiles required Product Grading to be enabled in System Settings.